Democrats are touting economic recovery heading into the 2024 elections, and liberal pundits are claiming that “Bidenomics” is working and those who disagree are disillusioned or ruthlessly partisan. But the country’s impressive economic growth betrays the reality on the ground: Millions of Americans are being left behind.
Yes, those White House press releases and Treasury Department fact sheets are right: Broad economic indicators like gross domestic product and unemployment have markedly improved. Inflation is generally coming down, too.
“‘Bidenomics’ is working,” Biden said earlier this summer. “When I took office, the pandemic was raging and our economy was reeling, supply chains were broken, millions of people unemployed, hundreds of thousands of small businesses on the verge of closing after so many had already closed. Today, the U.S. has had the highest economic growth rate, leading the world economies since the pandemic.”
But data released late last month show food insecurity at its highest level since Biden took office, and average financial hardship in 2023 is worse than it was over the last three years. In other words, “Bidenomics,” the president’s economic plan to grow the economy “from the middle out and the bottom up,” has been accompanied by a humanitarian crisis.
This is a disaster of Democrats’ own making. Aid measures had previously softened the blow of the COVID-19 pandemic, and Democrats vowed to make much of that aid permanent by enacting a robust social agenda. That agenda never materialized, and the government instead cut off the temporary aid programs — leaving many millions of Americans struggling to stay afloat.
Watch The Lever
Make sure you’re subscribed to The Lever on YouTube to get our latest video reports and other special content.
An Ongoing Crisis
Not everyone agrees that “Bidenomics” has been a success. A recent poll found that only 34 percent of Americans approve of Biden’s economic leadership, compared to his 41-percent overall approval rating. Just 20 percent of voters think the economy is good or excellent, compared to 78 percent who say it is only fair or poor, according to another survey.
A third recent poll found that nearly 70 percent of Americans think the economy is worse now than in 2020, when the pandemic started in the U.S.
Many pundits attribute the public’s discontent to ignorance or partisanship. As Jacobin recently noted, MSNBC’s Joe Scarborough cited the increase in the country’s economic productivity to suggest that “America is doing just fine,” while New York Times columnist Paul Krugman blamed partisan bias for the “huge gaps between what people say about the economy and both what the data says and what they say about their own experience.”
Along the same lines, economist Justin Wolfers recently told MSNBC that Americans feel negative about the economy because the conversation has been politicized, suggesting that people “tell themselves stories that are completely at odds with reality.”
The way to cut through the partisan noise, according to Wolfers, is to shift the economic conversation from the national to the personal level. Once the topic centers on people’s own household economic conditions, “all of a sudden there is this incredible optimism,” said Wolfers. In other words, just ask around.
The Census Bureau has been asking. Through its Household Pulse Survey, the agency has been tracking the socioeconomic impact of the pandemic and Americans’ recovery since April 2020. The data are wide-ranging, collected monthly, and disseminated in near real-time. A review of these surveys by The Lever reveals an ongoing humanitarian crisis.
Two of the survey’s longest-running questions concern financial hardship — people who reported that it was somewhat or very difficult to pay for basic household expenses in the last seven days — and food insecurity, tracking those who sometimes or often did not have enough to eat the week before. Data from the most recent survey period were released in late July.
For the first time under the Biden administration, food insecurity rates eclipsed 12 percent, marking a fourth consecutive month of increase. What’s more, average financial hardship and food insecurity rates this year exceed the previous three.
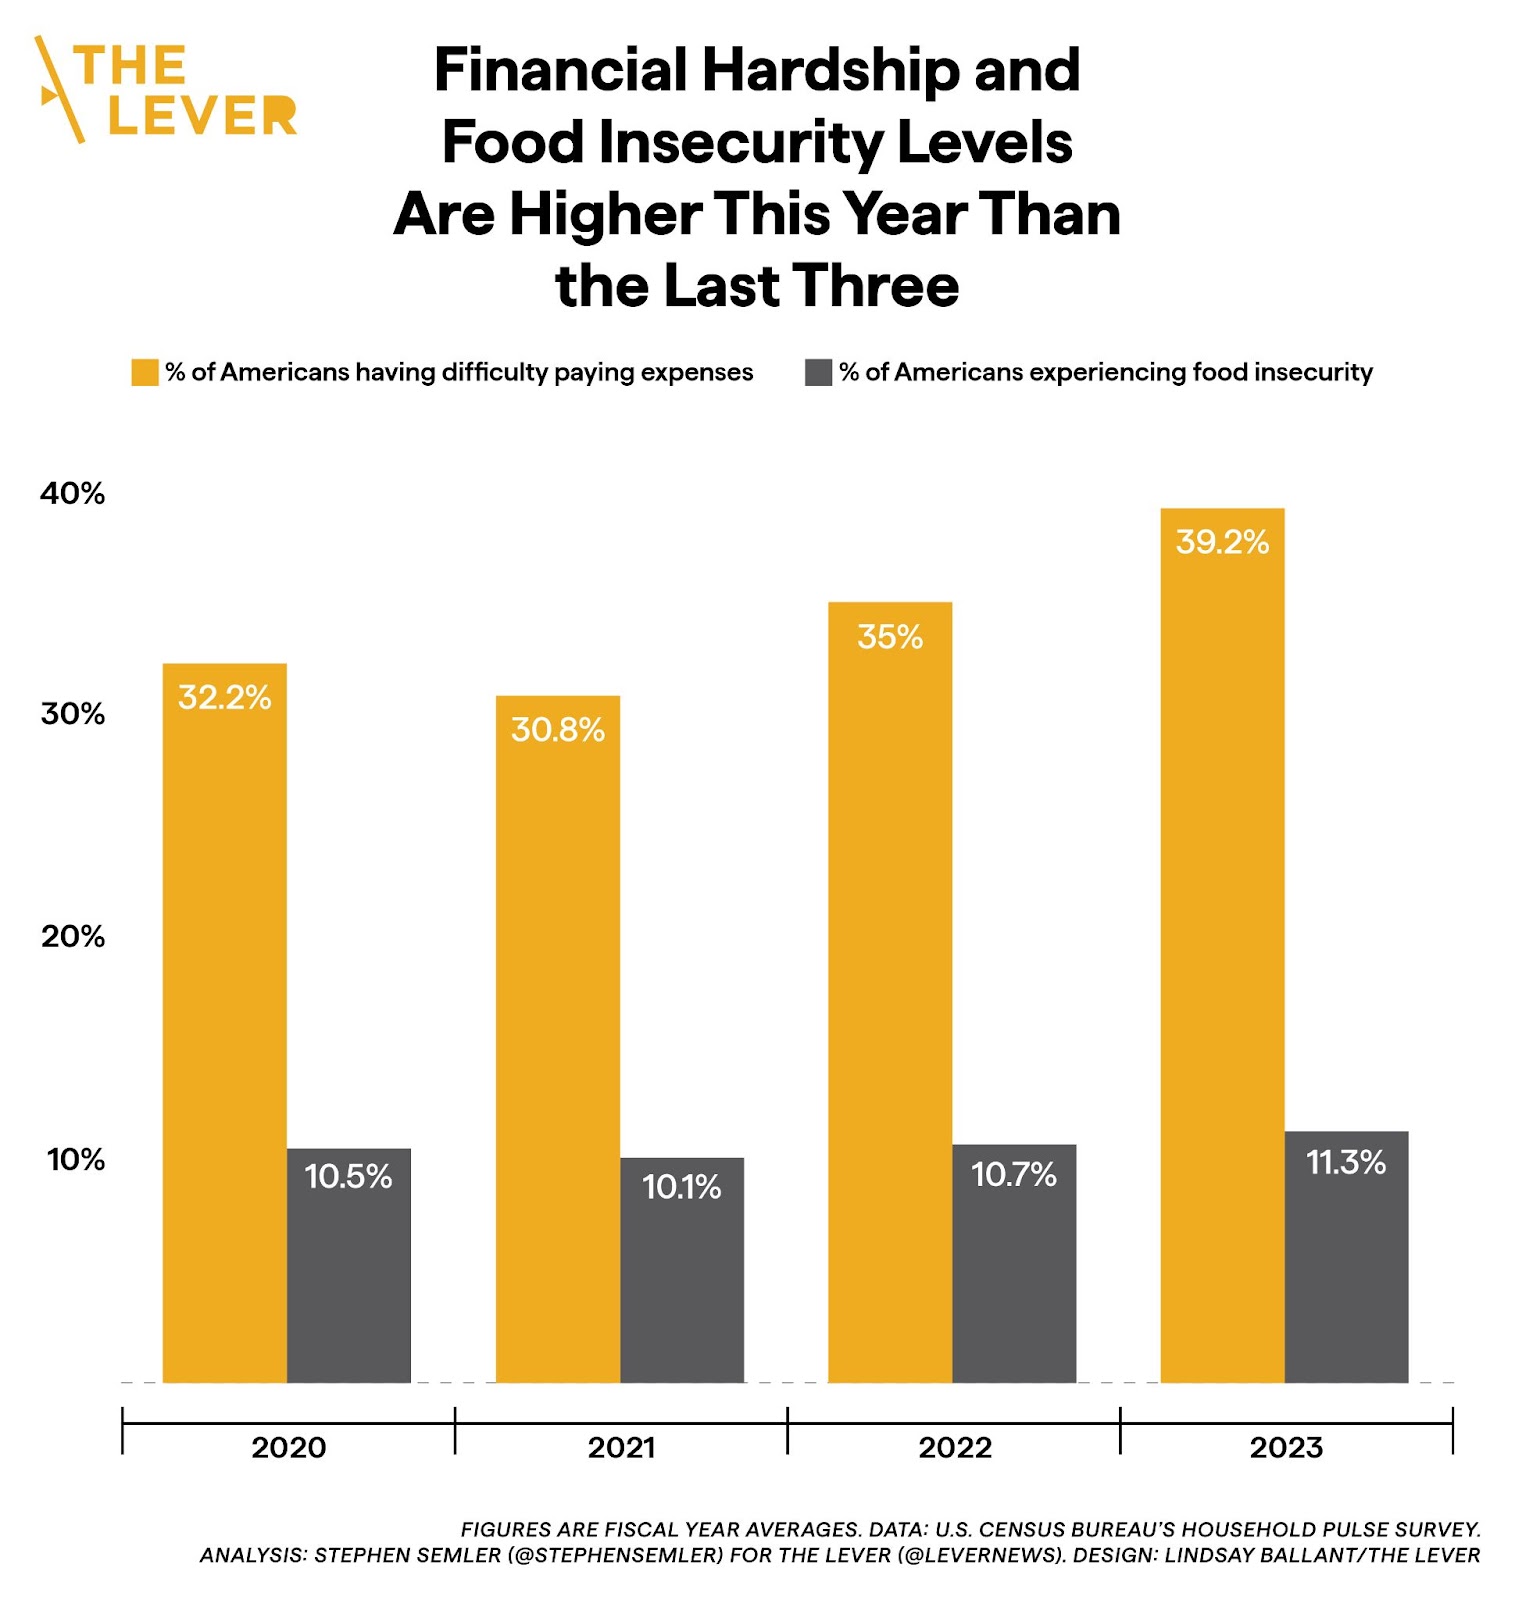
If there’s good news, it’s that financial hardship fell below 38 percent for the first time since last April — though the latest figure is still higher than any point in 2020 or 2021.

Behind The Data, A Policy Mess
These financial and food insecurity numbers should be considered a crisis, and in the first two years of the pandemic, they were.
The federal government brought these figures down by deploying a range of new social welfare initiatives, starting in March 2020 with the Coronavirus Aid, Relief, and Economic Security (CARES) Act. The law, among other things, temporarily boosted unemployment benefits, provided free school meals, and distributed $1,200 pandemic relief checks.
A federal foreclosure moratorium was announced later that month. In September, the Centers for Disease Control and Prevention issued a nationwide eviction ban.
In December 2020, Congress authorized another round of $600 relief payments. By mid-January 2021, economic and food insecurity rates had fallen 2.4 percent, freeing nine million people from financial distress and six million from hunger.
Conditions further improved after Biden’s American Rescue Plan authorized $1,400 relief checks and a slew of anti-poverty measures beginning in March 2021 — including enhanced child tax credits, expanded family food assistance, additional child care provider grants, extended unemployment benefits, and more.
In August 2021, there were 19 million fewer people in financial distress than when Biden entered office. The food-insecure population had dropped by more than six million.
But those achievements didn’t last. That same month, the eviction ban expired. The following month, extended unemployment coverage with additional benefits and the foreclosure ban ended as well. Then, the enhanced child tax credits, which reduced food insecurity by three percent in households with children, weren’t renewed for 2022.
These pandemic aid programs were allowed to expire in the middle of a cost-of-living crisis, as the cost of goods and services, energy prices, and interest rates were all rising.
The result? The number of people in financial distress increased by 29 million and the food-insecure population grew by 6 million from September 2021 to September 2022. Just when people needed extra help, existing assistance was taken away.
The last major spending bill enacted by the Democratic trifecta at the end of last year terminated enhanced funding for the Supplemental Nutrition Assistance Program (SNAP) this spring, leaving about 32 million people with less food assistance. The estimated drop in monthly benefits that occurred as a result range anywhere from $95 to $320, depending on the household. The extra benefits that kept 4.2 million people out of poverty in late 2021 were gone.
Many of the 41 million SNAP participants were likely caught off guard by this change. Politicians barely mentioned it; the media failed to adequately cover it. The bill itself was passed during the holidays and is thousands of pages long. Even if those impacted somehow spotted the specific provision in the text that terminated the emergency allotments (on page 1536), they would still only have had about 60 days to prepare for the dramatic reduction in food assistance.
The bill also ended a 2020 requirement that states couldn’t boot people off Medicaid, the national health insurance program for low-income Americans, in exchange for expanded federal funding.
After the mandate was terminated, states quickly started purging people from their health insurance rolls. More than four million Medicaid enrollees have been disenrolled since April. Most of these people have been terminated for procedural reasons — such as failing to respond to a piece of mail on time or due to bureaucratic errors at state agencies — not because they are technically ineligible for the program.
Anywhere between 17 million and 24 million people could lose Medicaid coverage by May 2024.
Only one Democrat, New York Rep. Alexandria Ocasio-Cortez, voted against this spending bill.
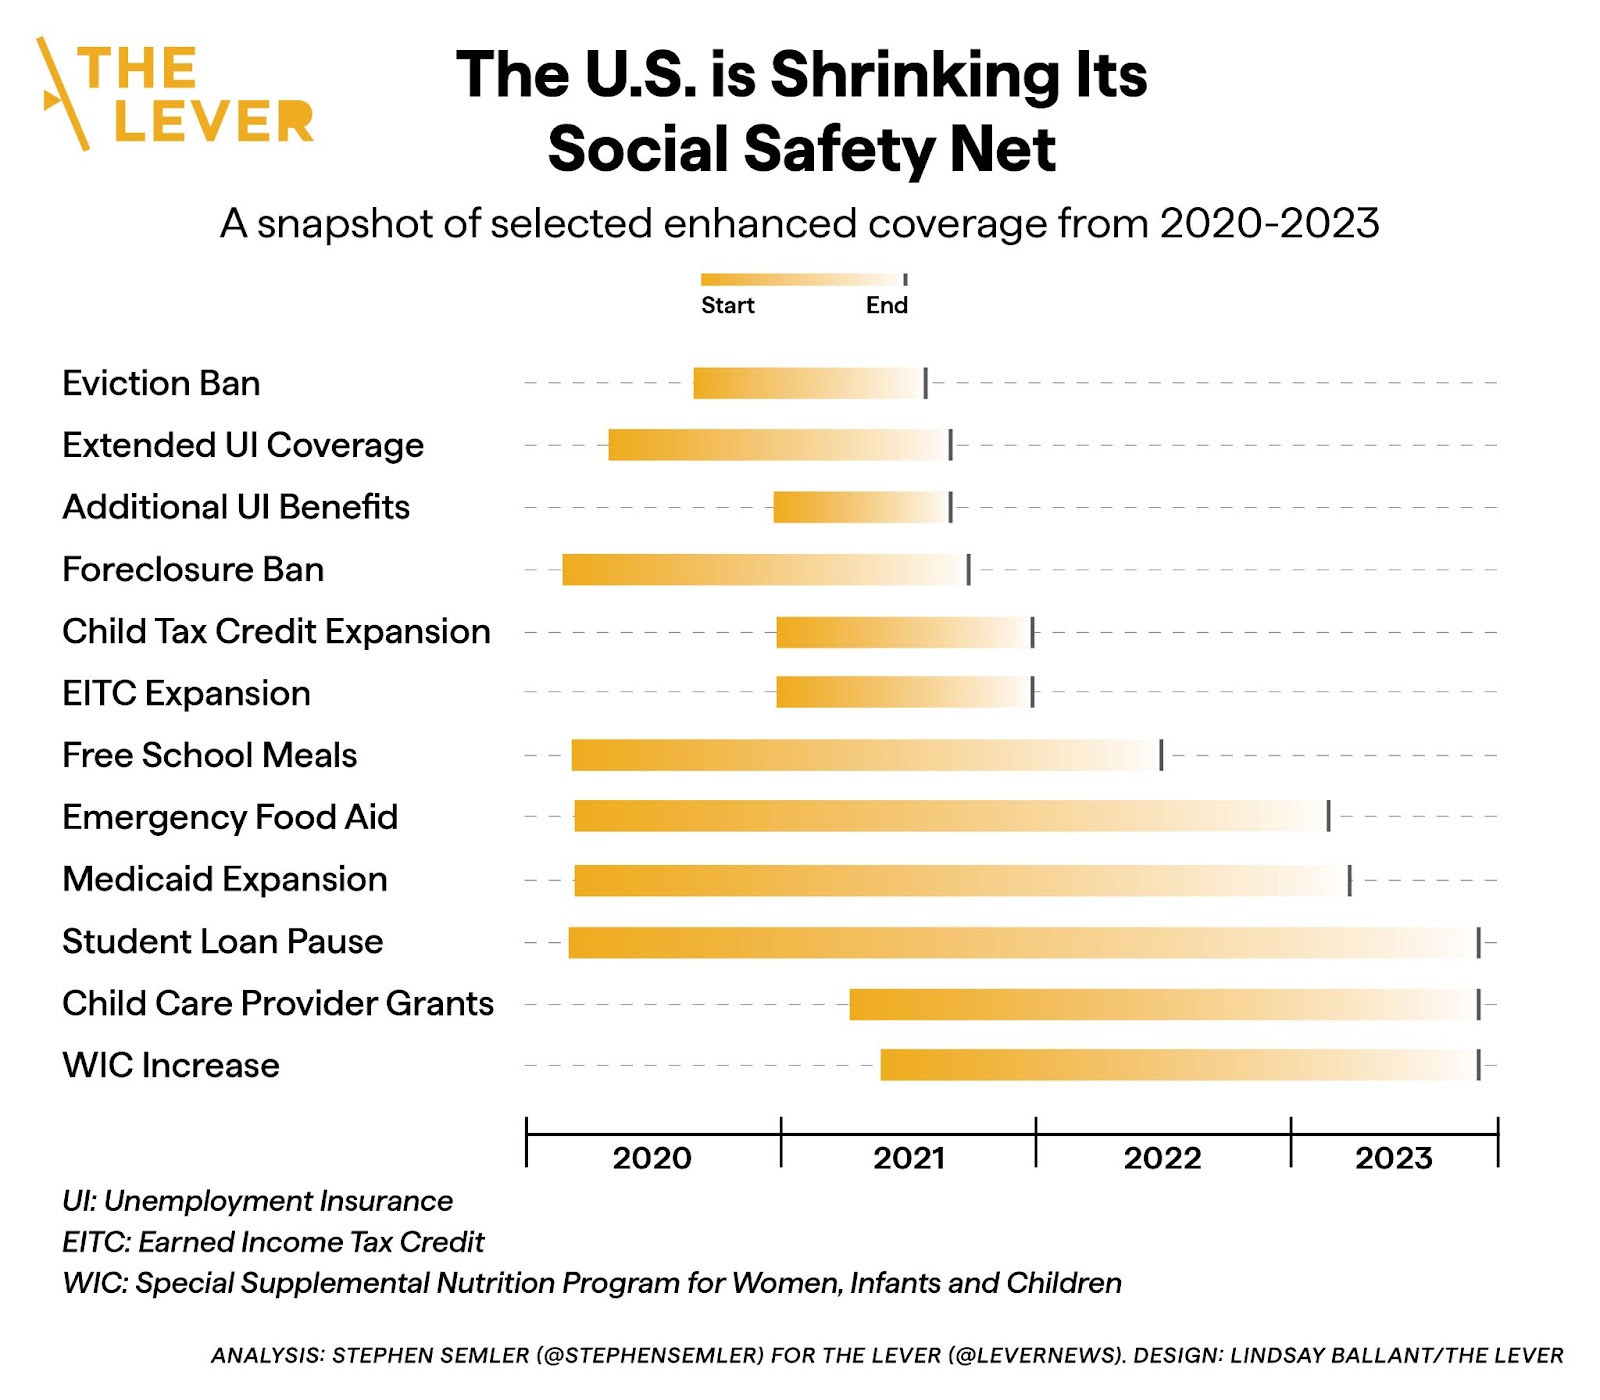
This attack on welfare programs explains why the strong economic recovery has left so many people behind. The social safety net continues to atrophy: Supplemental funding for child care provider grants is shrinking, and extra assistance for the Special Supplemental Nutrition Program for Women, Infants, and Children (WIC) expires on September 30.
Student loan repayments, paused since the start of the pandemic, are slated to begin the next day, as are additional work requirements being imposed on SNAP beneficiaries, thanks to the bipartisan budget agreement Biden negotiated with House Speaker Kevin McCarthy (R-Calif.).
No Building Back Better
The temporary welfare superstructure erected for the pandemic is being dismantled with nothing to replace it, leaving tens of millions of Americans in the lurch. This wasn’t supposed to happen. Democrats led voters to believe that they wouldn’t be left high and dry — as the emergency benefits expired, they should have been replaced with permanent ones.
This is what “building back better” was supposed to be all about: As Biden said in his 2022 budget request, the goal is “not simply to emerge from the immediate crises we inherited, but to build back better.”
He proposed a two-part economic agenda to build off of the immediate relief provided by the American Rescue Plan: The American Jobs Plan, for climate-friendly infrastructure, and the American Families Plan, for health and social welfare. The White House reasoned that these should take the place of additional emergency relief, effectively pouring cold water on a fourth round of checks.
The $2.7 trillion infrastructure plan was first unveiled in March 2021. By the time the Senate had approved the bipartisan infrastructure bill that August, Biden and Senate Republicans had negotiated it down to a climate-unfriendly bill worth just $548 billion. Many provisions that fell out were later stuffed into the $3.5 trillion reconciliation bill alongside the welfare programs of the American Families Plan.
To ensure that that bill wasn’t hollowed out too, Democrats committed to tethering the conservative-leaning infrastructure bill and the much more progressive human infrastructure bills together. Biden said he’d veto the former if it wasn’t delivered to his desk with the latter. Then-House Speaker Nancy Pelosi (D-Calif.) said, “There ain’t no infrastructure bill without the reconciliation bill.”
The Congressional Progressive Caucus promised to vote down the infrastructure bill until the Senate passed the reconciliation bill.
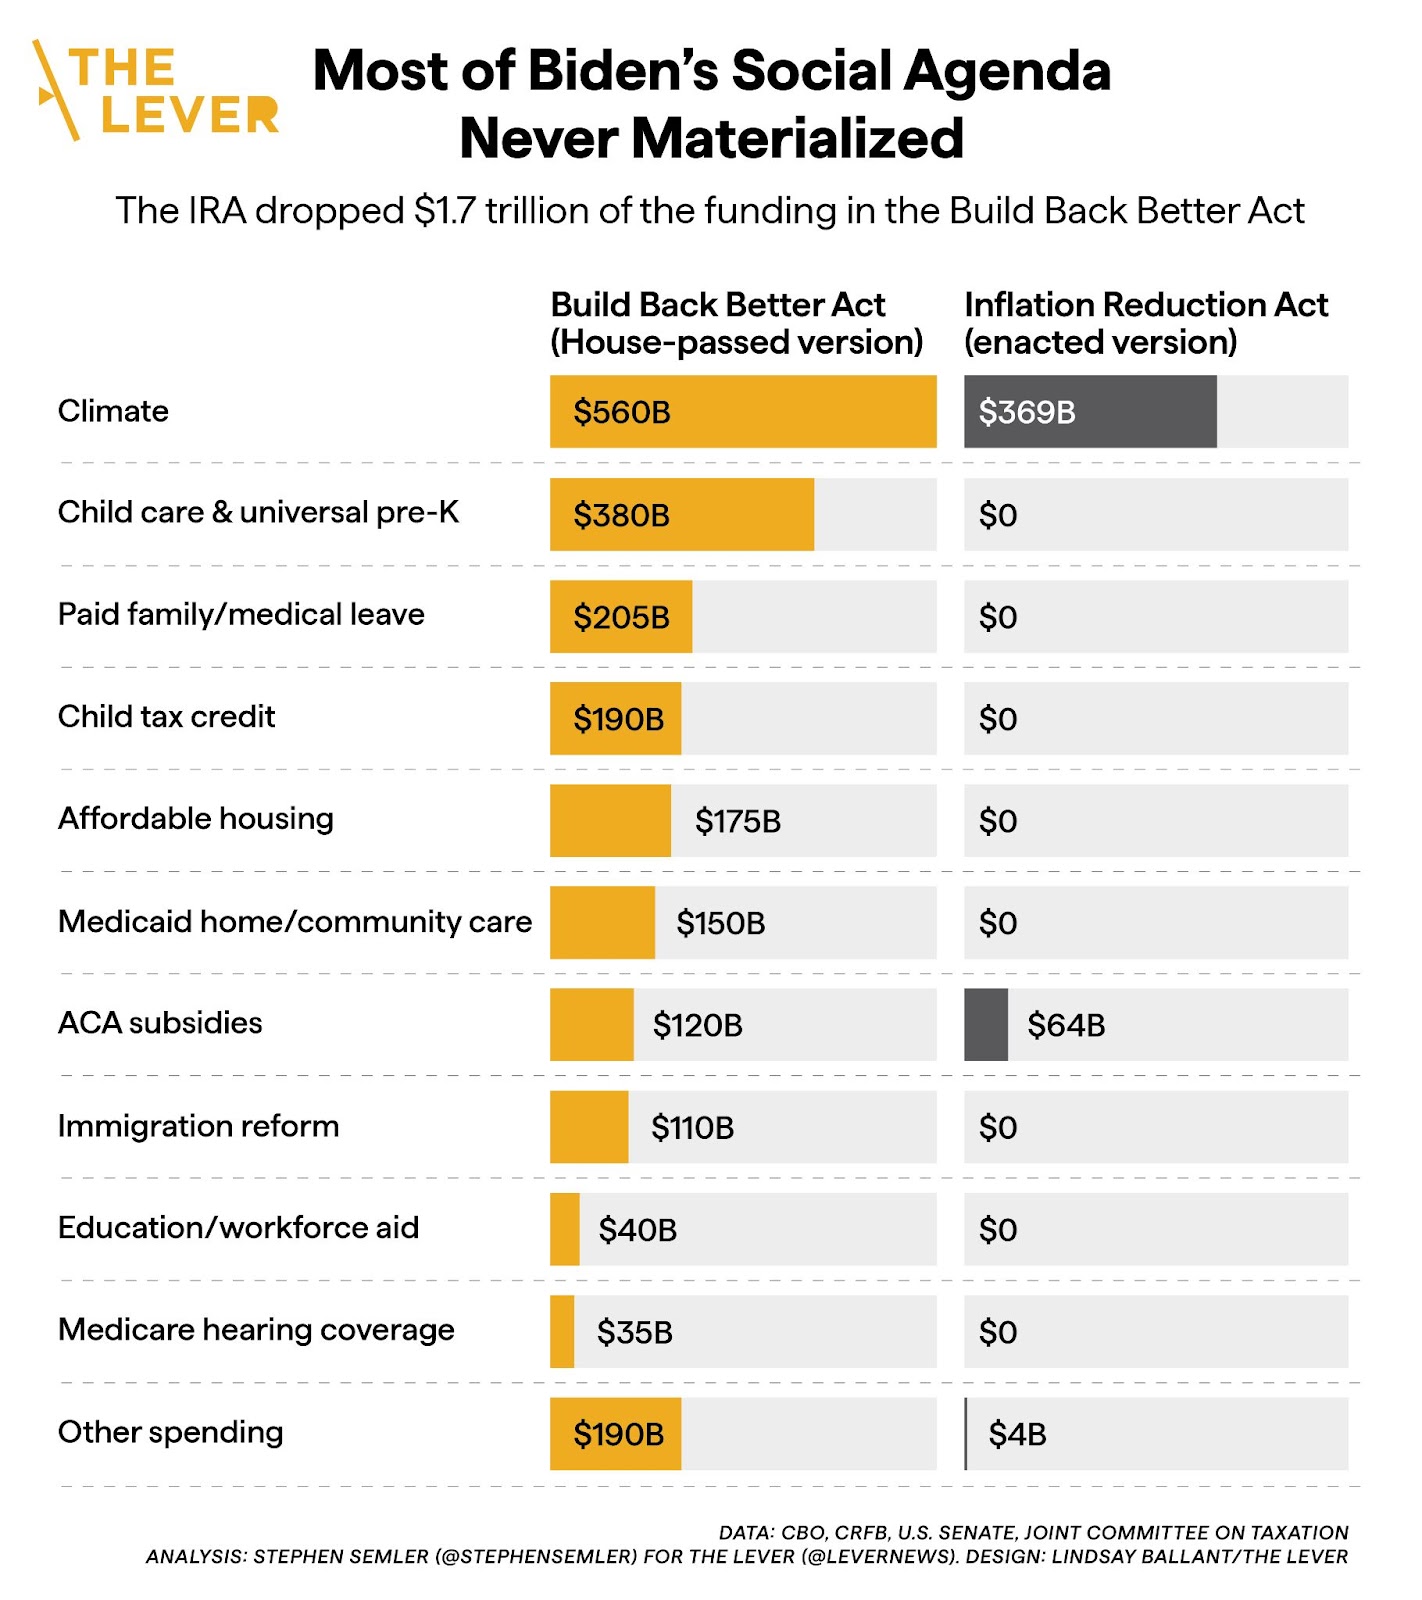
But Biden and Pelosi then reneged on their pledge and insisted the bills be passed independently, effectively dooming the welfare bill. Progressive lawmakers resisted for a while, but eventually gave up their leverage. The House-passed version still contained a formidable $2.2 trillion November 2021, but by the time the Senate had approved and renamed it the Inflation Reduction Act, it was worth just $437 billion.
Delinking the reconciliation and infrastructure bills ended up costing the public $1.7 trillion worth of climate, health, and anti-poverty programs. The health and anti-poverty programs that should have kicked in after temporary coverage expired were all left out.
The result isn’t captured by macroeconomic indicators. Broad measures of the country’s economy don’t necessarily reflect the economic conditions of the people living in it. The data we have on those conditions reveal an ongoing humanitarian crisis — one that Democrats were complicit in making, but so far refuse to acknowledge.